IPMI Monitor
Web-based server hardware monitoring via IPMI and Redfish
IPMI Monitor
Free, self-hosted IPMI/BMC monitoring for your server fleet.

![]()
![]()
Collect System Event Logs (SEL), monitor sensors, track ECC errors, gather SSH system logs, and get alerts — all from a beautiful web dashboard.
📖 Documentation
| Guide | Description |
|---|---|
| User Guide | Complete documentation for using IPMI Monitor |
| IPMI SEL Reference | Decode BMC event logs and troubleshoot hardware issues |
| Developer Guide | Git workflow, releases, CI/CD |
🚀 Quick Start (v1.1.1)
Automated Deployment (Recommended)
Deploy everything with a single command using a config file:
# Install from dev branch (latest features)
pipx install git+https://github.com/cryptolabsza/ipmi-monitor.git@dev

# Deploy with config file (no prompts)
sudo ipmi-monitor quickstart -c /path/to/config.yaml -y
See examples/ipmi-config.yaml for a complete config template.
Interactive Setup
# Install pipx (prerequisite)
apt install pipx -y && pipx ensurepath
source ~/.bashrc

# Install the CLI tool
pipx install ipmi-monitor

# Run the quickstart wizard (use full path since pipx bin isn't in sudo PATH)
sudo ~/.local/bin/ipmi-monitor quickstart
That’s it! The wizard will:
- ✅ Detect DC Overview and import existing servers/SSH keys
- ✅ Detect or manually add your servers with BMC IPs
- ✅ Configure IPMI and SSH credentials
- ✅ Deploy Docker containers (ipmi-monitor + cryptolabs-proxy; cryptolabs-proxy deploys cryptolabs-watchtower for auto-updates)
- ✅ Set up SSL with Let’s Encrypt (with auto-renewal)
- ✅ Enable automatic updates via Watchtower
- ✅ Trigger initial data collection on first start
Docker Run (Alternative)
docker run -d \
  --name ipmi-monitor \
  -p 5000:5000 \
  -v ipmi_data:/app/data \
  -e IPMI_USER=admin \
  -e IPMI_PASS=YOUR_BMC_PASSWORD \
  -e ADMIN_PASS=YOUR_ADMIN_PASSWORD \
  -e SECRET_KEY=YOUR_RANDOM_SECRET_KEY \
  ghcr.io/cryptolabsza/ipmi-monitor:latest
Then open http://localhost:5000 and add your servers!
See User Guide for Docker Compose setup.
💻 CLI Commands
After installation, use the ipmi-monitor CLI:
| Command | Description |
|---|---|
sudo ipmi-monitor quickstart |
⚡ One-command Docker deployment (recommended) |
ipmi-monitor status |
Show container status |
ipmi-monitor logs [-f] |
View container logs |
ipmi-monitor start |
Start containers |
ipmi-monitor stop |
Stop containers |
ipmi-monitor restart |
Restart containers |
ipmi-monitor upgrade |
Pull latest image & restart |
ipmi-monitor add-server |
Add a server interactively |
ipmi-monitor list-servers |
List configured servers |
ipmi-monitor setup-ssl |
Set up HTTPS reverse proxy |
ipmi-monitor uninstall |
Uninstall IPMI Monitor (with options) |
ipmi-monitor version |
Show detailed version info |
ipmi-monitor setup-ssl |
Retry Let’s Encrypt SSL setup |
📸 Screenshots
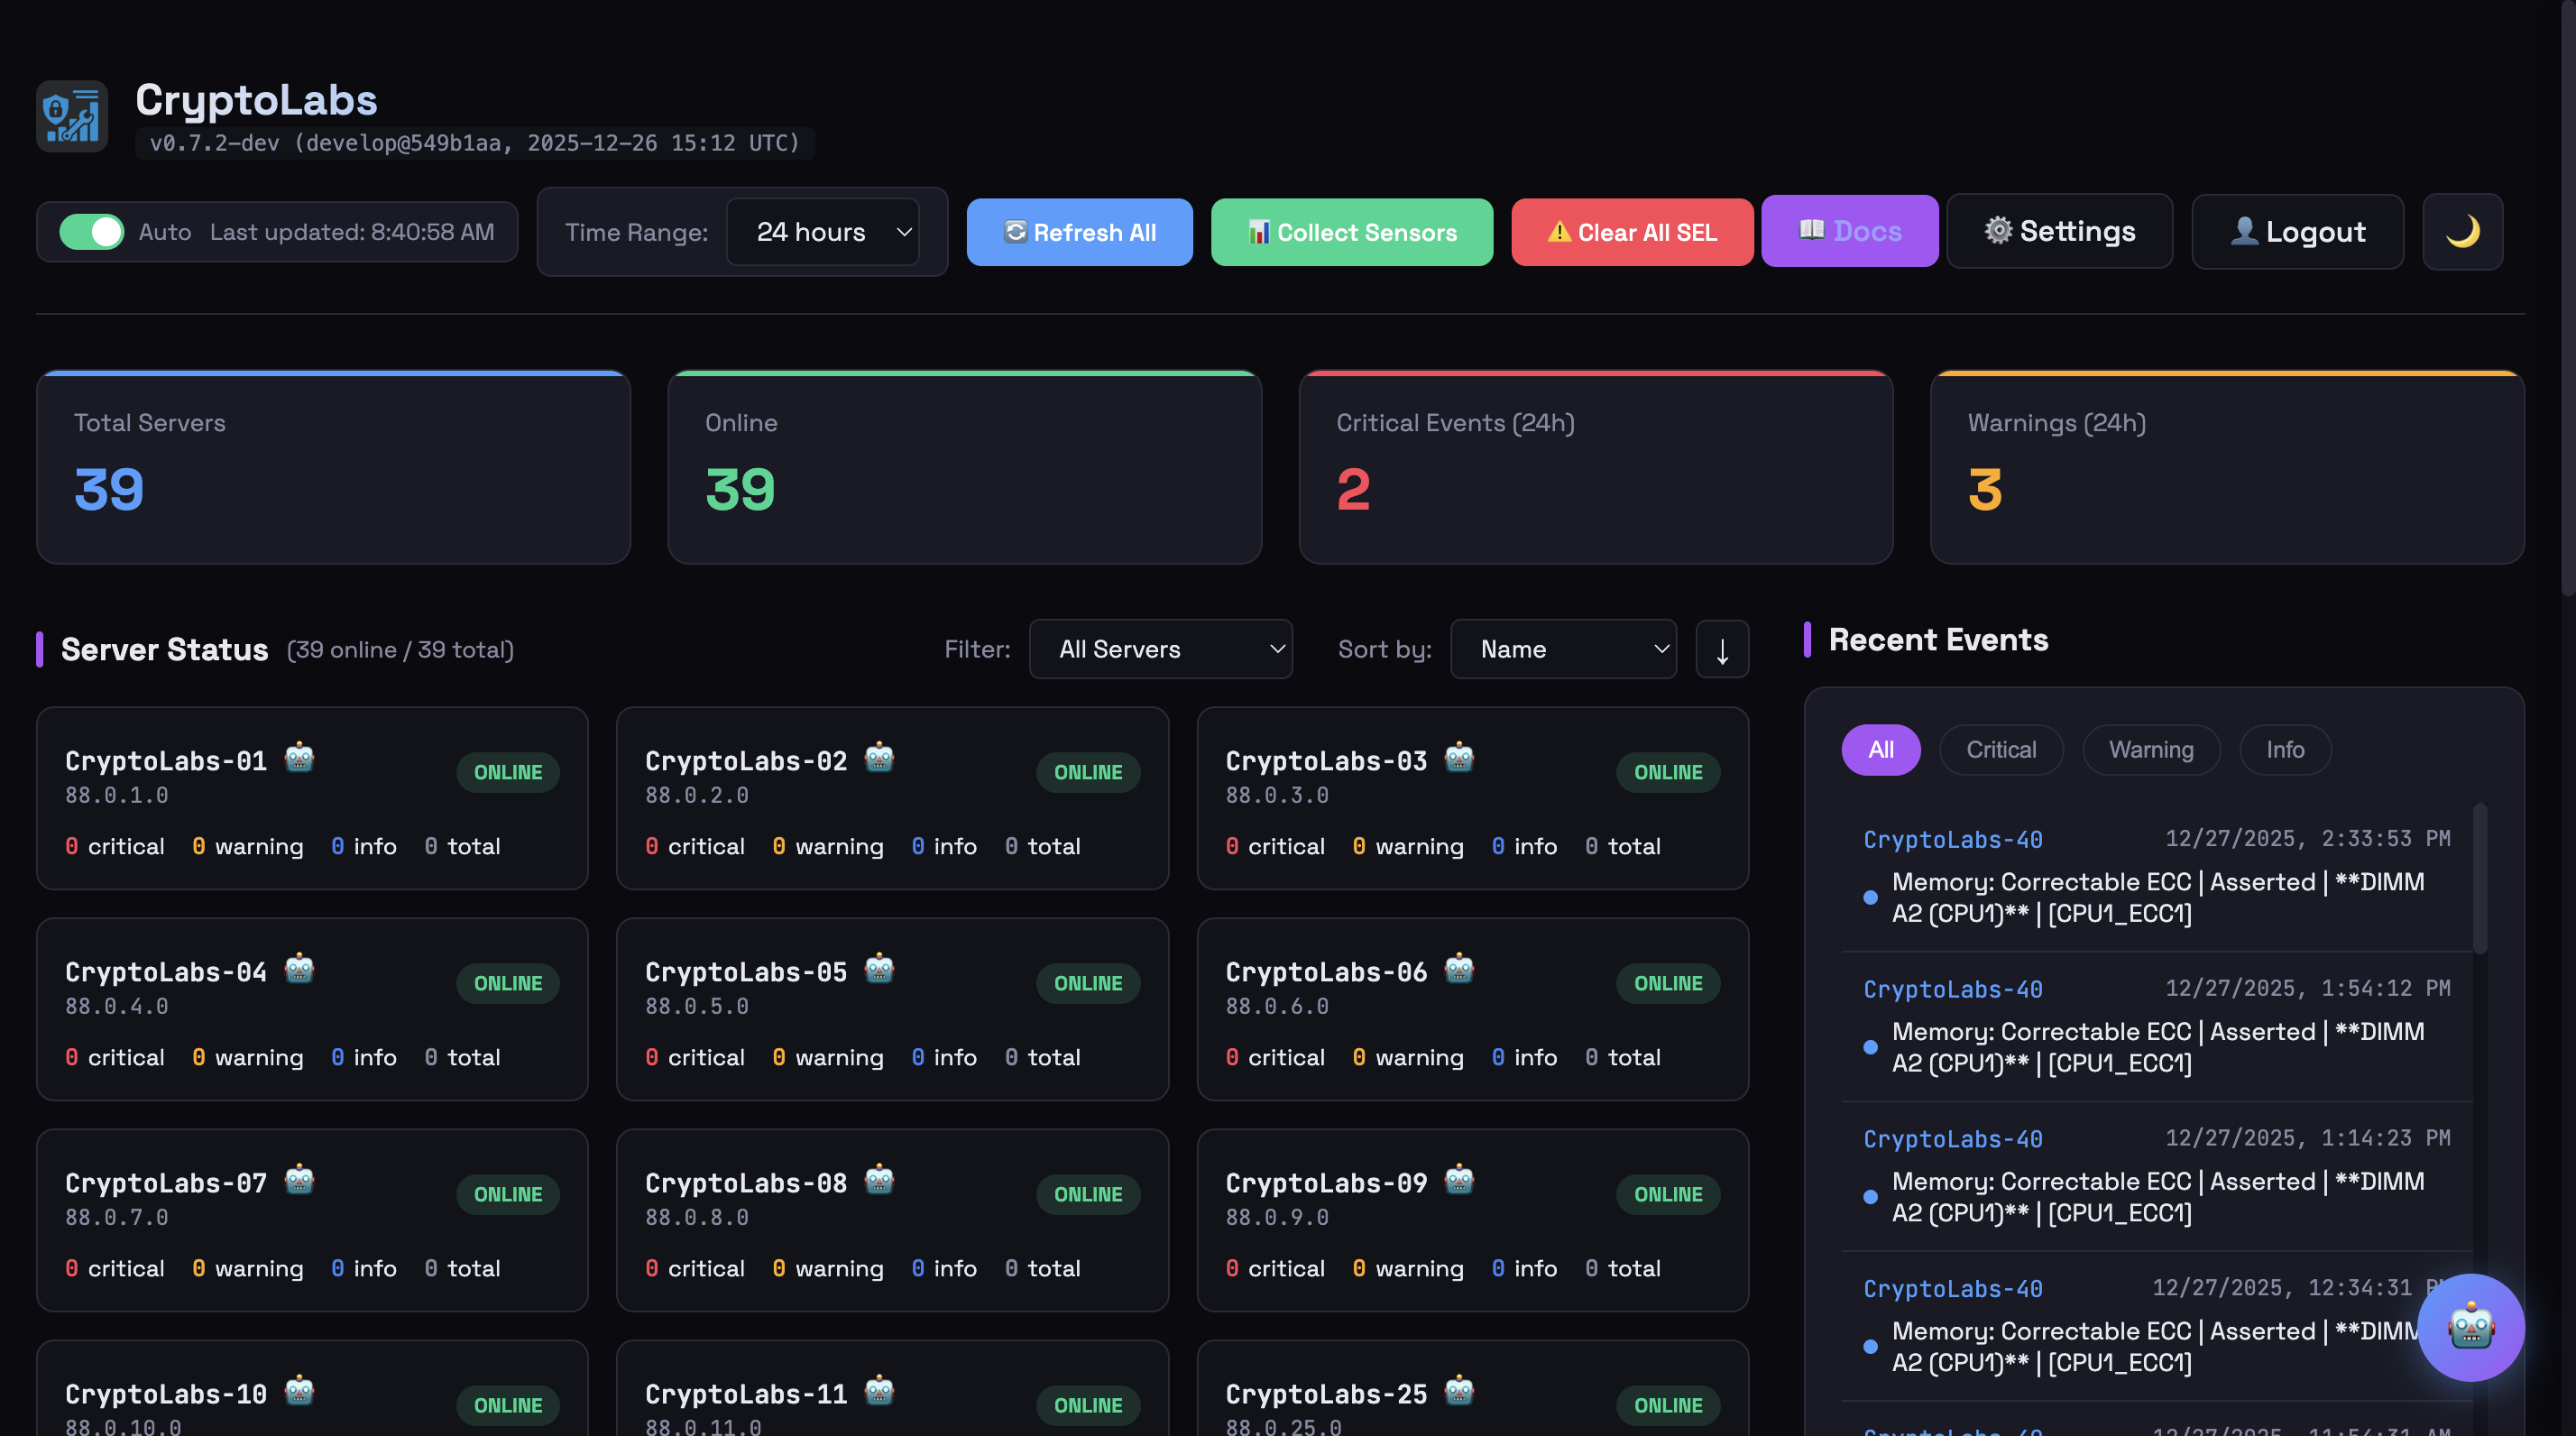 Main dashboard showing 39 servers with real-time status
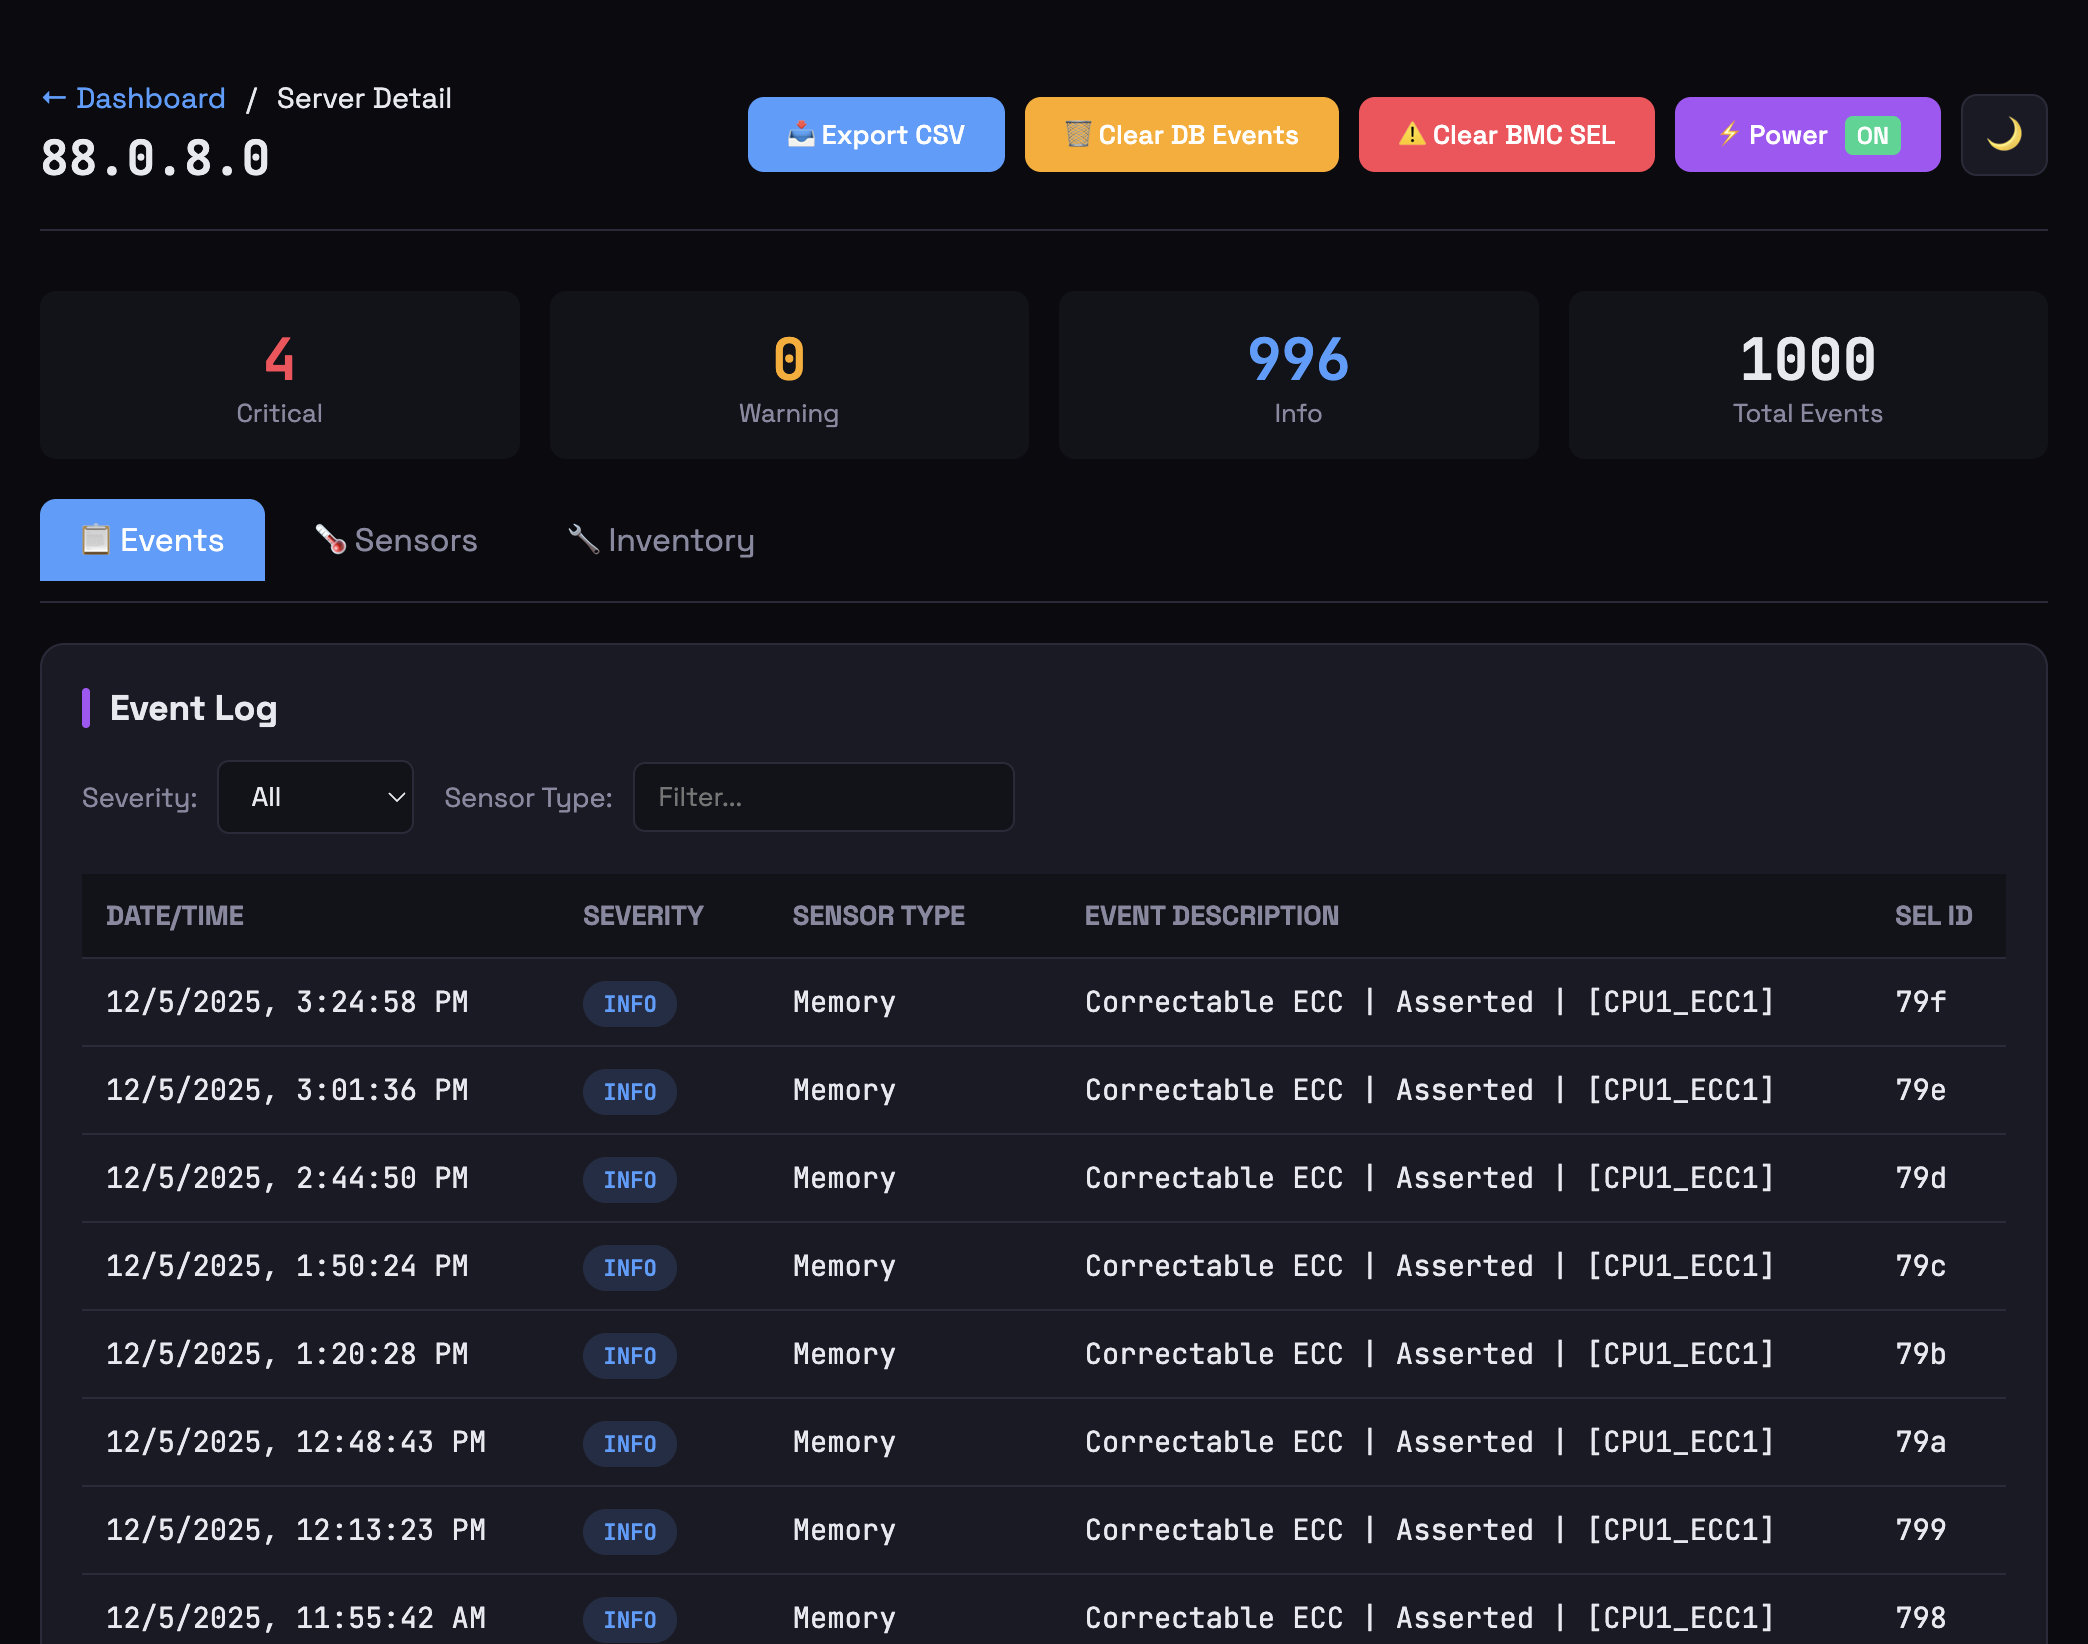 Event Log - SEL events |
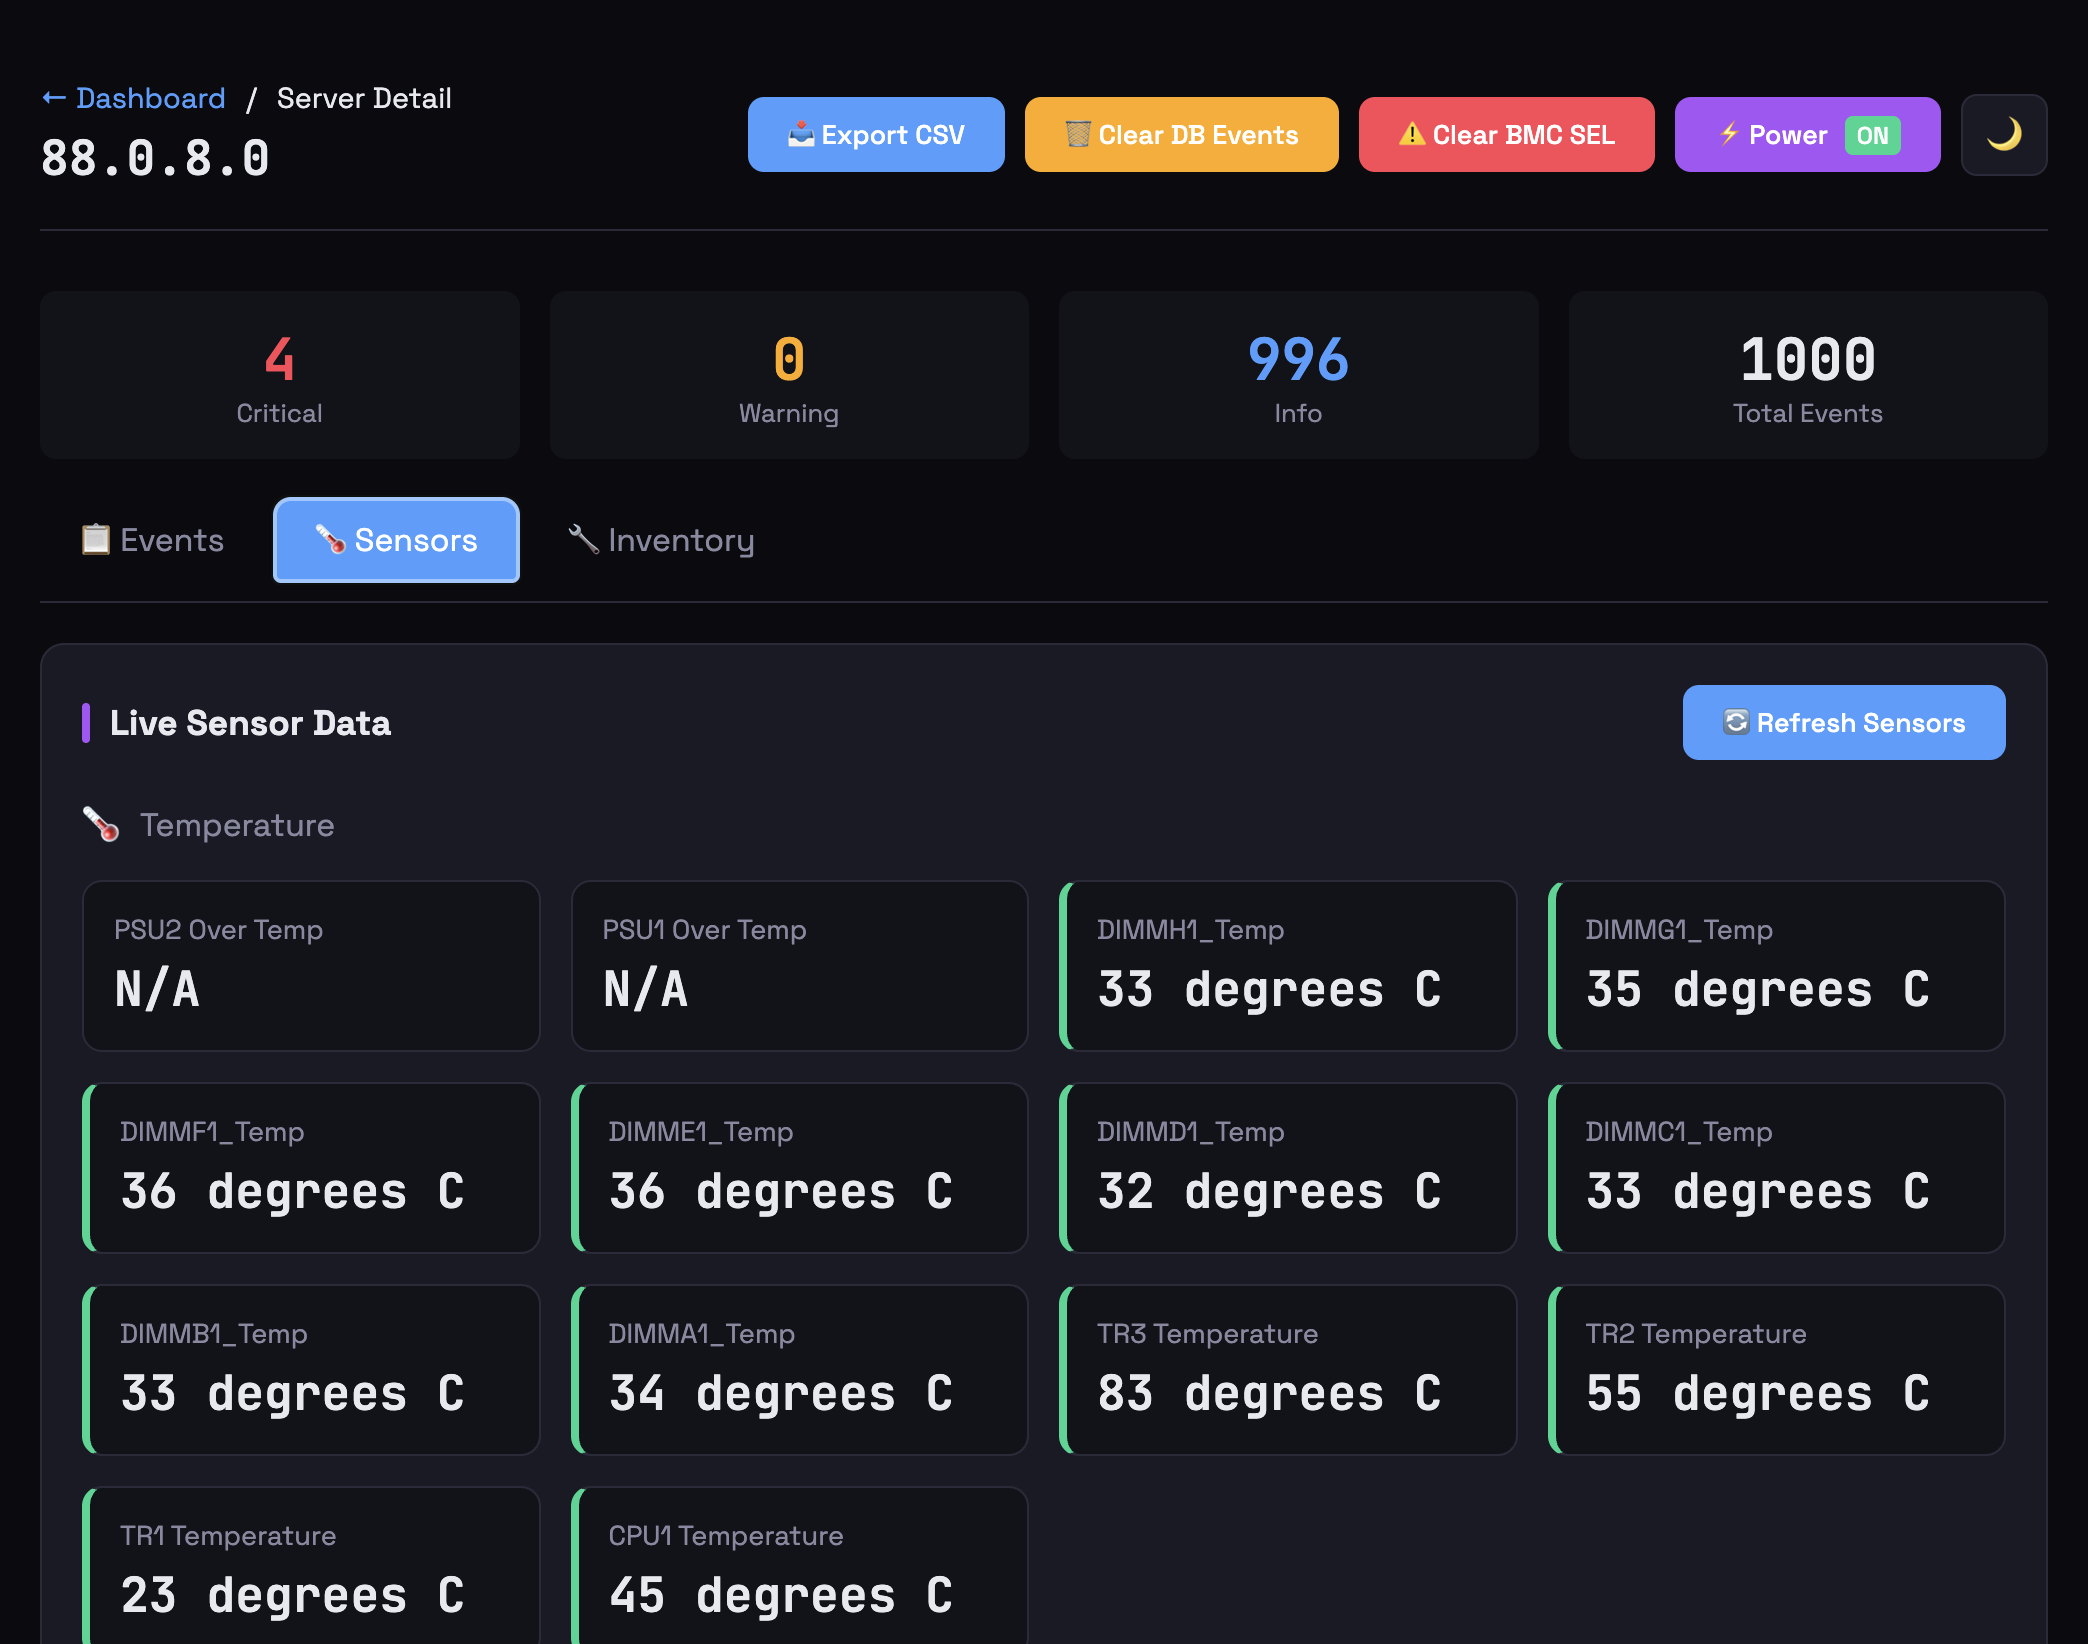 Live Sensors |
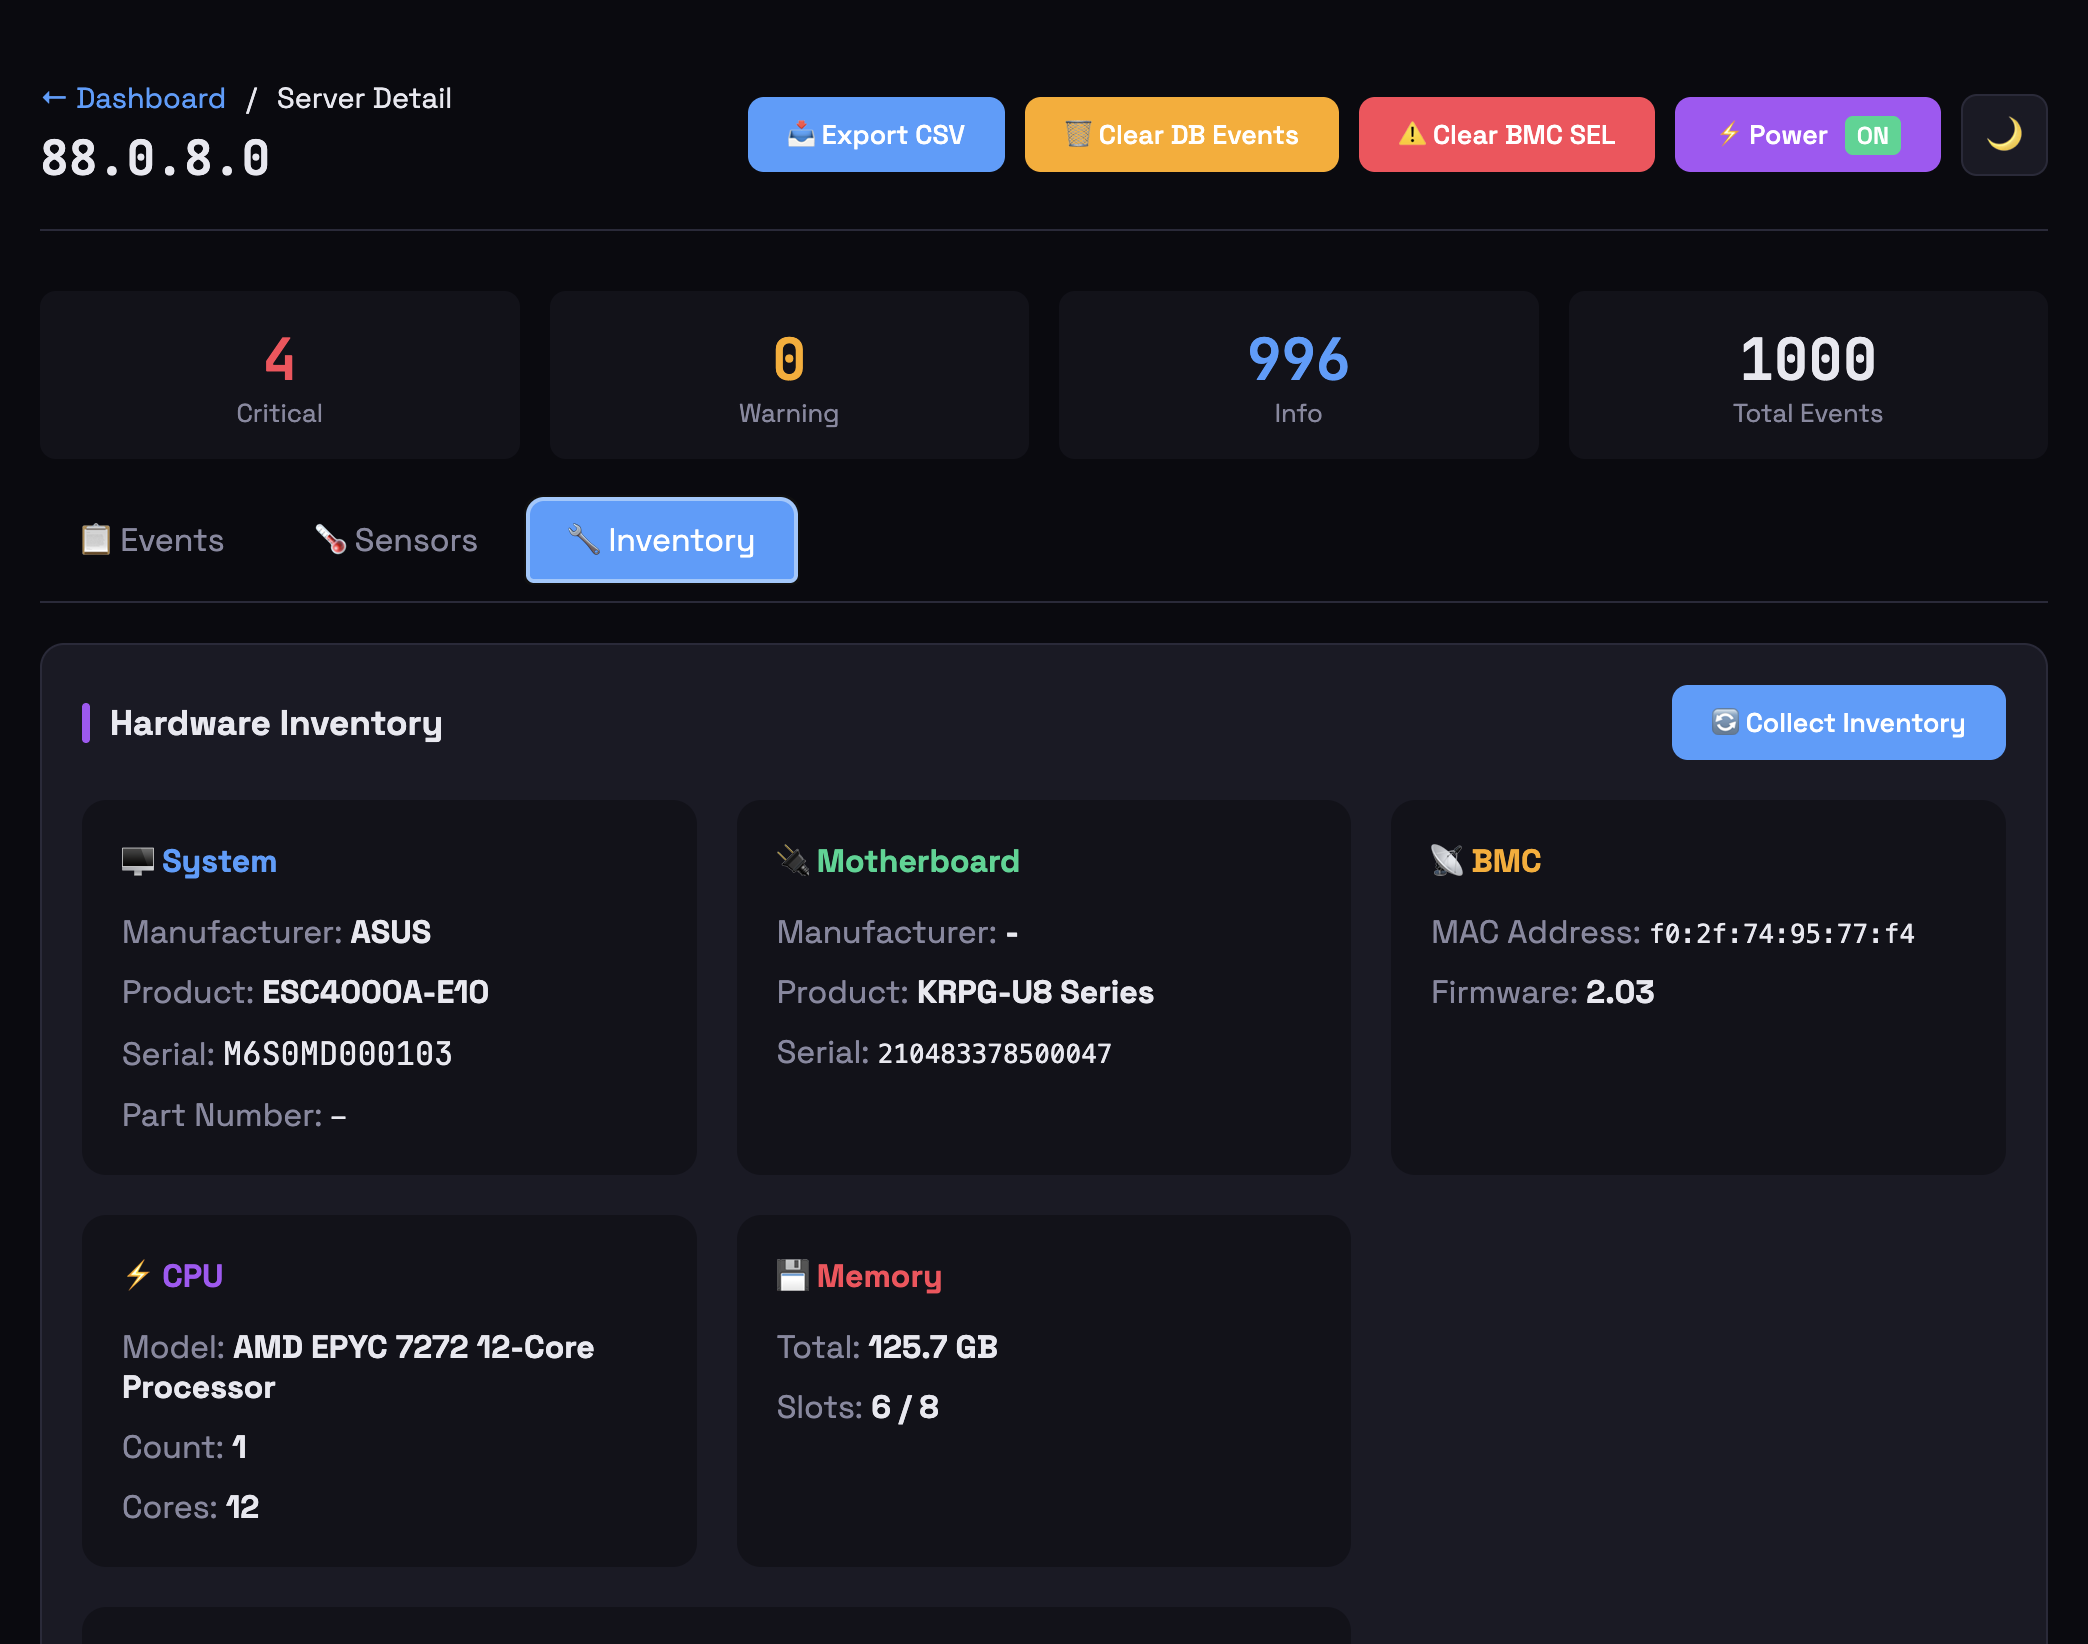 Hardware Inventory |
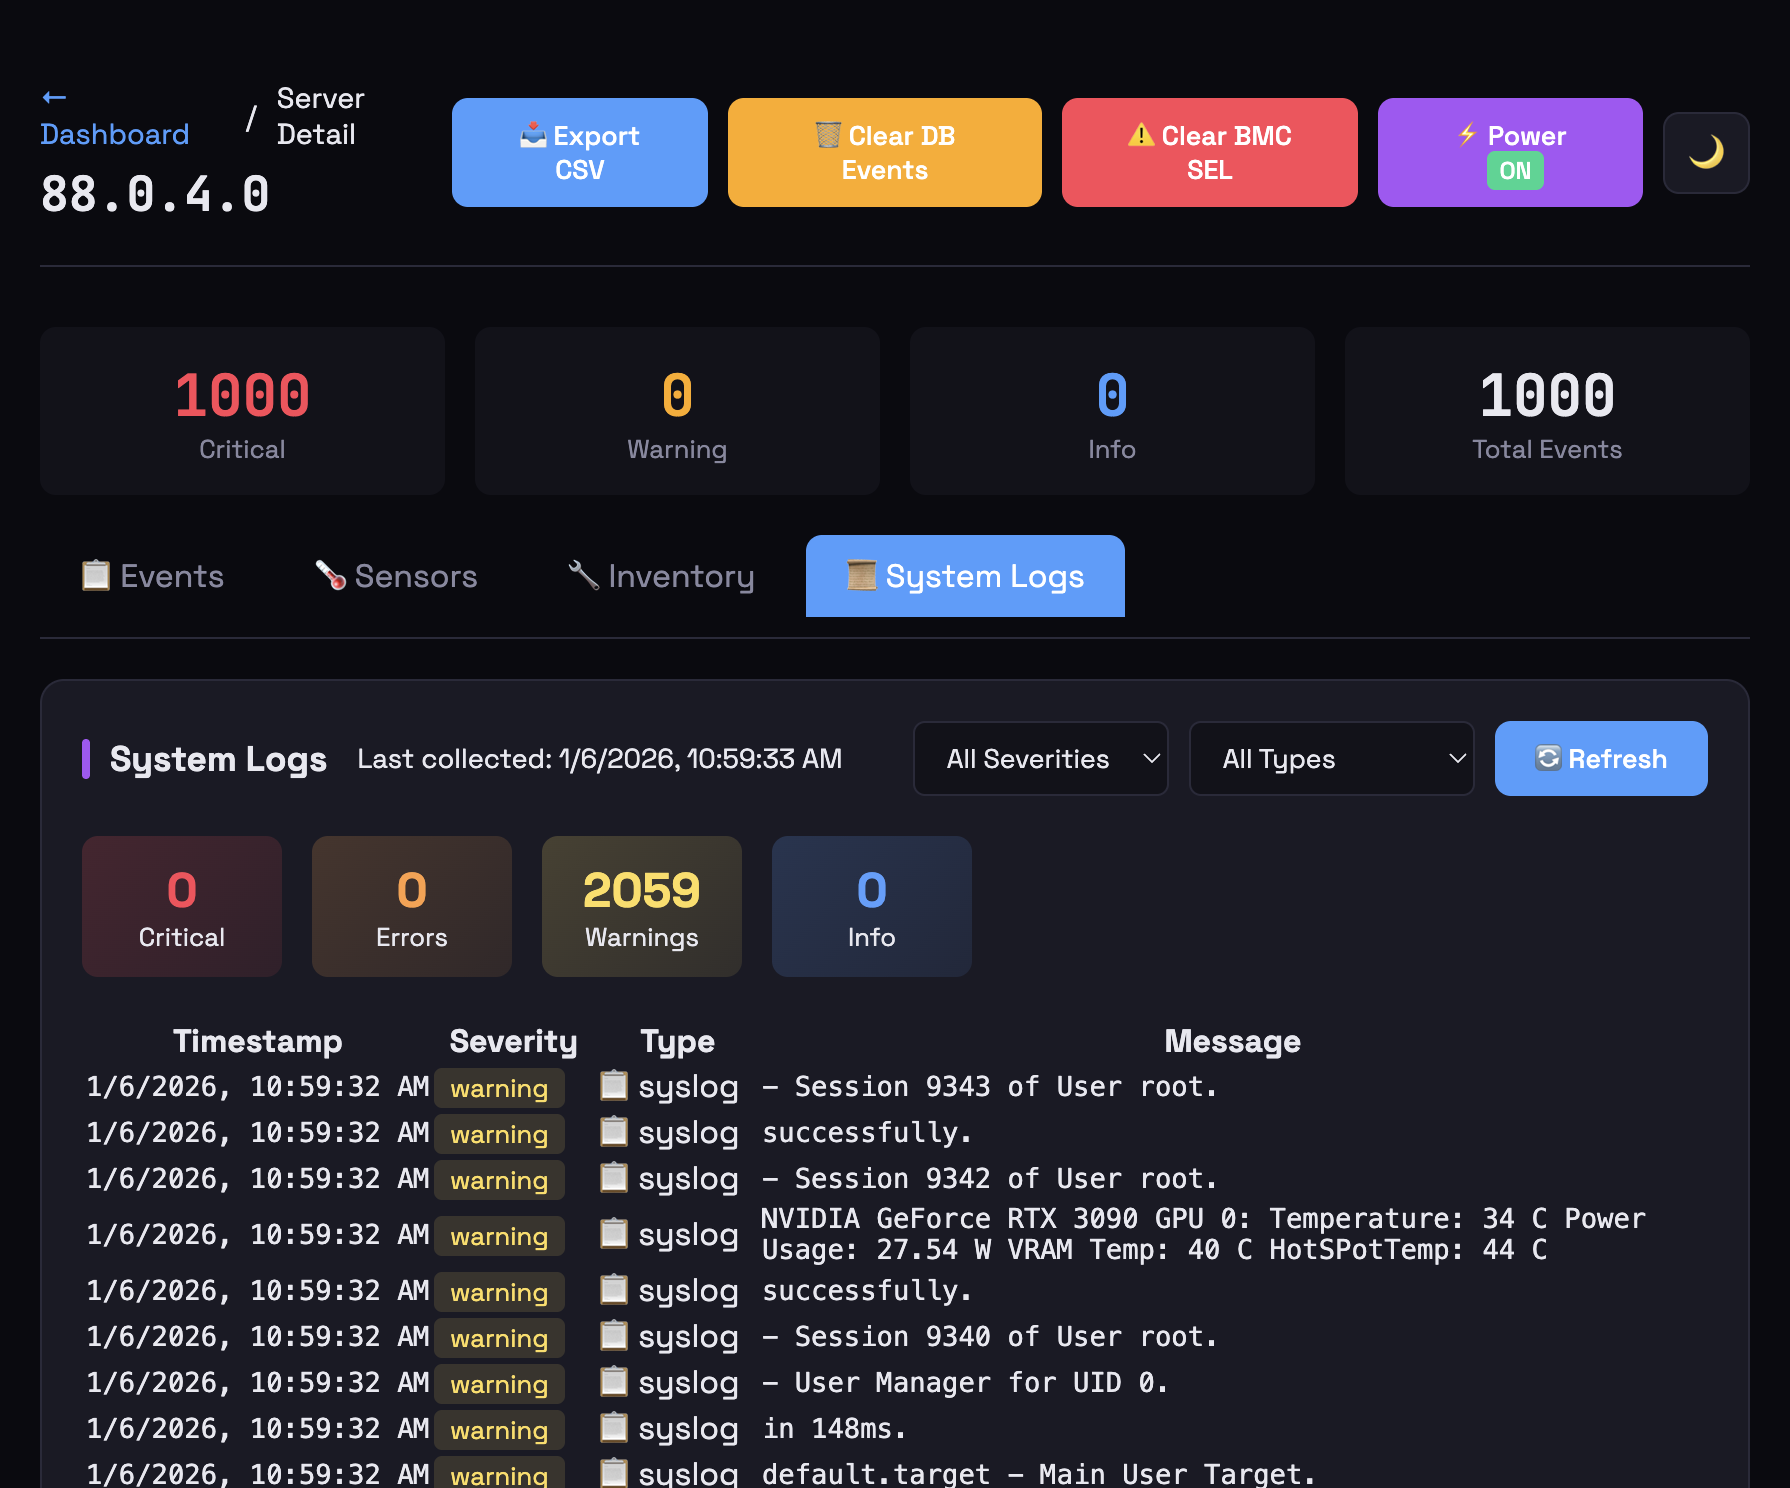 SSH System Logs |
✨ Features
🆓 Free Self-Hosted
| Feature | Description |
|---|---|
| 🔍 SEL Collection | Parallel IPMI event collection (32 workers) |
| 📊 Real-time Dashboard | Auto-refreshing server status cards |
| 🌡️ Sensor Monitoring | Temperature, fan, voltage, power readings |
| 💾 ECC Tracking | Identify which DIMM has memory errors |
| 🎮 GPU Health | Detect NVIDIA Xid errors via SSH |
| 📜 SSH System Logs | Collect dmesg, journalctl, syslog, mcelog |
| 🖥️ Platform Logs | Collect Vast.ai daemon and RunPod agent logs |
| 🔧 Hardware Errors | AER, PCIe, ECC errors parsed automatically |
| 🚨 Alerts | Email, Telegram, webhook notifications |
| ✅ Alert Resolution | Notify when issues clear |
| 📈 Prometheus | Native /metrics endpoint for Grafana |
| 🔐 User Management | Admin and read-only access levels |
| 📥 Backup/Restore | Export everything for disaster recovery |
| 🔃 BMC Reset | Cold/warm reset without affecting host OS |
| 🐳 Docker Ready | Multi-arch images (amd64/arm64) |
| 🔄 Auto-Updates | Watchtower keeps containers updated |
🆕 What’s New in v1.1.1
| Feature | Description |
|---|---|
| 📦 Quickstart Wizard | One-command Docker deployment with CryptoLabs Proxy, SSL, Watchtower |
| 🌐 CryptoLabs Proxy | Unified reverse proxy with Fleet Management landing page at / |
| 🔗 DC Overview Import | Auto-detect DC Overview installation and import servers/SSH keys |
| 🔐 SSH Key Management | Auto-detect keys, paste content, or generate new ED25519 keys |
| 📜 SSH Log Collection | Optional SSH log collection (dmesg, syslog, GPU errors) during setup |
| 🚀 Initial Data Collection | Fresh installs auto-collect sensors/events with progress modal |
| 🔒 Auto SSL Renewal | Certbot container automatically obtains/renews Let’s Encrypt certs |
| 🌐 Subpath Routing | Deploy at /ipmi/ alongside other CryptoLabs services |
| 🏷️ Site Name Branding | Configure site name via DC Overview for consistent branding |
| 🖥️ Vast.ai/RunPod Logs | Auto-collects daemon logs when deployed via DC Overview with exporters |
| 🔄 Watchtower Integration | Automatic container updates every 5 minutes |
| 👤 Read-Write Role | New role with settings access but no user management |
| 📥 Fixed Export/Import | Alert rules now export/import correctly |
| 📋 SEL Management | Enable/disable event logging, view SEL info, get SEL time |
| 💚 Sensor Highlighting | Changed sensor values pulse green after refresh |
| ⏳ Diagnostics Loading States | Download buttons show progress to prevent double-clicks |
| 📊 Grafana Config | prometheus.yml example and endpoint documentation |
| 🛡️ Uninstall Options | Choose to remove containers, config, or both |
🤖 AI Features (Optional)
Upgrade with AI-powered insights from CryptoLabs:
| Feature | Description |
|---|---|
| 📊 Daily Summaries | AI-generated fleet health with GPU focus |
| 🔧 Maintenance Tasks | Auto-generated from events |
| 📈 Predictions | Failure warnings before they happen |
| 🔍 Root Cause Analysis | AI explains what went wrong |
| 💬 AI Chat | Ask questions about your servers |
| 🤖 Recovery Agent | Autonomous GPU recovery with escalation |
| 🏢 Multi-Site | One account, multiple datacenters |
| 📋 Task Queue | AI sends recovery tasks for execution |
Start your free trial: Settings → AI Features → Start Free Trial
⚙️ Configuration
| Variable | Default | Description |
|---|---|---|
APP_NAME |
IPMI Monitor | Displayed in header |
IPMI_USER |
admin | Default BMC username |
IPMI_PASS |
(required) | Default BMC password |
ADMIN_PASS |
changeme | Dashboard admin password |
SECRET_KEY |
(auto) | Flask session secret (set this!) |
POLL_INTERVAL |
300 | Seconds between collections |
SSH_LOG_INTERVAL |
(disabled) | Minutes between SSH log collection |
🔒 Security
IPMI Monitor is designed for production datacenter environments:
- No Command-Line Exposure - Passwords via environment variables
- SSH Key Isolation - Private keys in temporary files with 0600 permissions
- No Credential Sync - Credentials never sent to AI cloud
- Local-First - All data stored locally, cloud sync optional
- Secret Redaction - AI responses automatically mask credentials
🏗️ Architecture
IPMI Monitor runs as Docker containers with CryptoLabs Proxy for unified reverse proxy:
┌────────────────────────────────────────────────────────────────────┐
│                         Your Server                                 │
│  ┌──────────────────────────────────────────────────────────────┐  │
│  │ cryptolabs-proxy           Port 80/443 (HTTP/HTTPS)          │  │
│  │  ├── /          → Fleet Management Landing Page              │  │
│  │  ├── /ipmi/     → IPMI Monitor                               │  │
│  │  └── /dc/       → DC Overview (if installed)                 │  │
│  └──────────────────────────────────────────────────────────────┘  │
│                           │                                         │
│  ┌────────────────────────▼──────────────────────────────────────┐ │
│  │ ipmi-monitor              Port 5000 (internal)                │ │
│  │  • Flask web application with SQLite                          │ │
│  │  • Background workers (IPMI polling, SSH log collection)      │ │
│  │  • Initial data collection on first start                     │ │
│  └───────────────────────────────────────────────────────────────┘ │
│                           │                                         │
│  ┌────────────────────────▼──────────────────────────────────────┐ │
│  │ certbot                  Auto SSL renewal (every 12h)         │ │
│  │ watchtower               Auto container updates (every 5m)    │ │
│  └───────────────────────────────────────────────────────────────┘ │
└────────────────────────────────────────────────────────────────────┘
              │                              │
              ▼                              ▼
    ┌─────────────────┐          ┌─────────────────┐
    │  BMC/IPMI       │          │  Server OS      │
    │  (port 623)     │          │  (SSH port 22)  │
    └─────────────────┘          └─────────────────┘
Live Example: dc.cryptolabs.co.za - Fleet Management at /, IPMI Monitor at /ipmi/
📋 API Reference
IPMI Monitor exposes 150+ REST API endpoints. Here are the most commonly used:
Dashboard & Events
| Endpoint | Description |
|---|---|
GET / |
Web dashboard |
GET /api/servers |
List all servers with status |
GET /api/events |
Get events (supports filters) |
GET /api/stats |
Dashboard statistics |
GET /api/maintenance |
Maintenance tasks |
GET /api/recovery-logs |
Recovery action history |
GET /api/uptime |
Server uptime data |
Server Management
| Endpoint | Description |
|---|---|
GET /api/servers/managed |
All configured servers |
POST /api/servers/add |
Add new server |
PUT /api/servers/{bmc_ip} |
Update server config |
DELETE /api/servers/{bmc_ip} |
Remove server |
POST /api/servers/import |
Bulk import servers |
GET /api/servers/export |
Export server list |
Per-Server Operations
| Endpoint | Description |
|---|---|
GET /server/{bmc_ip} |
Server detail page |
GET /api/server/{bmc_ip}/events |
Server’s events |
GET /api/sensors/{bmc_ip} |
Live sensor readings |
GET /api/server/{bmc_ip}/ssh-logs |
SSH system logs |
POST /api/servers/{bmc_ip}/inventory |
Collect inventory |
POST /api/server/{bmc_ip}/power/{action} |
Power control (on/off/reset) |
POST /api/server/{bmc_ip}/bmc/{action} |
BMC reset (cold/warm) |
POST /api/server/{bmc_ip}/investigate |
Post-recovery investigation |
SSH & Credentials
| Endpoint | Description |
|---|---|
GET /api/ssh-keys |
List stored SSH keys |
POST /api/ssh-keys |
Add SSH key |
POST /api/test/bmc |
Test BMC connection |
POST /api/test/ssh |
Test SSH connection |
POST /api/ssh-logs/collect-now |
Trigger SSH log collection |
Alerts & Notifications
| Endpoint | Description |
|---|---|
GET /api/alerts/rules |
Alert rules |
POST /api/alerts/rules |
Create alert rule |
GET /api/alerts/history |
Fired alerts |
GET /api/alerts/notifications |
Notification channels |
POST /api/alerts/notifications/{type}/test |
Test notification |
System & Monitoring
| Endpoint | Description |
|---|---|
GET /metrics |
Prometheus metrics |
GET /health |
Health check |
GET /api/version |
Version info |
GET /api/version/check |
Check for updates |
POST /api/collect |
Trigger IPMI collection |
AI Features
| Endpoint | Description |
|---|---|
GET /api/ai/status |
AI sync status |
GET /api/ai/config |
AI configuration |
POST /api/ai/sync |
Trigger AI sync |
GET /api/ai/results |
Cached AI results |
See User Guide for complete endpoint documentation.
🔗 Links
- GitHub: github.com/cryptolabsza/ipmi-monitor
- Docker: ghcr.io/cryptolabsza/ipmi-monitor
- Discord: Join our Discord
- AI Features: cryptolabs.co.za
🆘 Support
- 💬 Join our Discord - Get help, chat with the community
- 🐛 Report a Bug
- 💡 Request a Feature
- 💬 Discussions
- 📧 support@cryptolabs.co.za
MIT License · Made with ❤️ by CryptoLabs